Overview
$AVE IT is a desktop budget management application. The user interacts with it using a CLI, and it has a GUI created with JavaFX. It is written in Java, and has about 10 kLoC.
Summary of contributions
-
Major enhancement: added Report Feature
-
What it does:
-
It allows the user to generate a report based on their spending. User can specify the date range and type of graph for their report and how they want their spending to be categorised.
-
Added functionality to print and export the report.
-
Report is shown in a pop out window which also allow users to type in
Report commandsonly.
-
-
Justification:
-
This feature improves the product significantly because it gives user a overview of what they are spending on, which can equip them with better knowledge of their spending habits.
-
Some users might want to have a permanent copy of their report, hence the print and export report function was introduced which give users the choice of having both hard and soft copy of their report.
-
The pop out window was added to avoid cluttering the Main Window.
-
-
Highlights:
-
This feature works together with
expenditureandrepeatfeature.repeatfeature allowed expenditures to occur at varying frequency : daily, weekly, monthly or annually. This caused the calculation of spending to become complex especially since users are able to specify start and end date eg: 2020-03-12 to 2020-04-28 for report. -
Users can print or export report from either the Main Window or Report Window. This make implementation tedious as I had to ensure that the command input into Report Window does not reflect on Main Window.
-
Users can print or export report in Report Window at any time, so long the report is not changed by a
viewcommand.
-
-
Credits:
-
JavaFXSwingUtils is used for exporting and printing.
-
AB3 code for primary setup of Report Window.
-
-
-
Major enhancement : added Report Window
-
What it does:
-
Show cases the report user requested for.
-
It is able to take in
Report commands, execute and show case the result of the command.
-
-
Justification:
-
Avoid cluttering the Main Window UI with report showing there.
-
It is likely that users only needs report at specified occasions and not all the time, hence I implemented a pop out window which user can close when they no longer need the report.
-
-
Highlights:
-
This feature works with
Reportfeature. -
Users can also access the Report Window via
report buttonin Main Window, which made implementation slightly challenging as I had to take care of cases where there is no report generated.
-
-
-
Code contributed: RepoSense
-
Project management:
-
Managed release
v1.1-v1.2(3 releases) on GitHub
-
-
Enhancements to existing features:
-
Documentation:
-
Community:
-
Tools:
-
Integrated a third party library (JavaFxSwing) to the project (#219)
-
-
Contributions to the User Guide
Given below are sections I contributed to the User Guide. They showcase my ability to write documentation targeting end-users. |
Report (Ng Xin Pei)
Function
The Report feature allows you to have a quick overview of your expenditures. It can tell you your total spending within a period of time and have your spending categorised either by month or tag. You can have also have a permanent copy of the report, through the report printing and export capabilities.
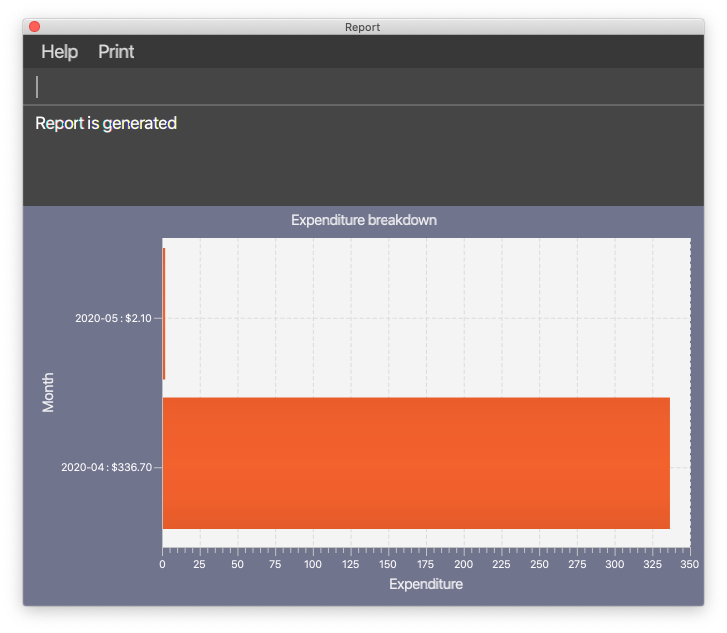
This is an example of the report in bar chart format with the expenditures grouped by months. The horizontal line represents the expenditures whereas the vertical line shows the month followed by the total spending in that month. Alternatively, you can also group the expenditure by tags and read off the bar chart in a similar fashion.
If you are a visual person, you can consider using the pie chart format instead!
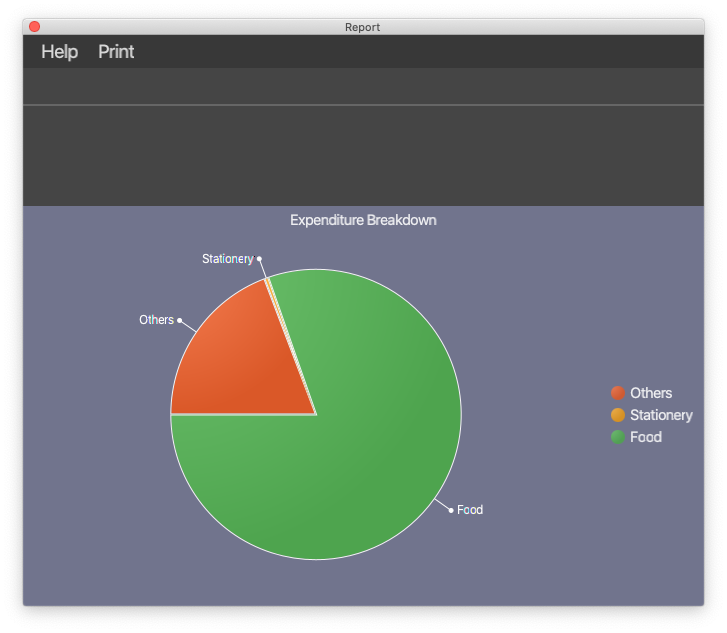
This is an example of report in pie chart format with the expenditures grouped by tags.
If you are interested to find out more, you can explore Report Command to find out how to generate these graphs.
Report commands
This section will talk about how you can use report feature. Before we begin with the details of the command, here are some tips:
-
Before beginning this section, you can refer to Report to look at how the reports will look like and how to read it.
-
If there is a huge difference in expenditure amounts, using a Bar chart will be better as overlaps might occur for Pie chart.
-
For best usage, keep start date and end date to be within 12 months for reports generated by months. Similarly, keep number of tags to be within 12 for reports generated by tags. It is possible that not all months or tags will be displayed, if start and end date exceeds 12 months or tags exceed 12.
-
Do read the NOTE section in the command, if any.
Viewing expenditures report: report view
Generates report on expenditure spending in the given period.
Format: report view -sd START_DATE -ed END_DATE -g GRAPH_TYPE -o ORGANISATION
Examples:
-
report view -sd 2020-03-01 -ed 2020-03-31 -g pie -o tag -
report view -sd 2020-03-01 -ed 2020-03-31 -g bar -o month
Exporting report: report export
Exports report on expenditure spending in the given period.
Format: report export -sd START_DATE -ed END_DATE -g GRAPH_TYPE -o ORGANISATION -f FILE_NAME
| The file can be identified by FILE_NAME.png whereby FILE_NAME is specified by your input in the command. The file can be found in the Report folder which will be in the same directory as the jar file if you are running it by double-clicking the jar file. If you run the jar file on cmd, the Report folder will be located in the directory where you run the jar file. |
Examples:
-
report export -sd 2020-03-01 -ed 2020-03-31 -g pie -o tag -f hello -
report export -sd 2020-03-01 -ed 2020-03-31 -g bar -o month -f report
Printing report: report print
Prints report on expenditure spending in the given period.
Format: report print -sd START_DATE -ed END_DATE -g GRAPH_TYPE -o ORGANISATION
| For best usage, avoid sending multiple print jobs in short period of time. This prevents the print jobs from getting lost. The window may be unresponsive if the default printer is not set up, this will last for a few seconds. Eventually, a response stating "Set available printer as default printer before printing" will be given. |
Examples:
-
report print -sd 2020-03-01 -ed 2020-03-31 -g pie -o month -
report print -sd 2020-03-01 -ed 2020-03-31 -g bar -o tag
Report Window Commands
These are the commands to be executed in the report window. Before we begin with the details of the command, here are some tips:
-
Before beginning this section, you can refer to Report to look at how the reports will look like and how to read it.
-
If there is huge difference in expenditure amount, using a Bar chart will be better as overlaps might occur for Pie chart.
-
For best usage, keep start date and end date to be within 12 months for reports generated by months. Similarly, keep number of tags to be within 12 for reports generated by tags. It is possible that not all months or tags will be displayed, if start and end date exceeds 12 months or tags exceed 12.
-
Do read the NOTE section in the command, if any.
Viewing expenditures report
The result of this command is equivalent to Viewing expenditures report: report view.
|
Generates report on expenditure spending in the given period.
Format: view START_DATE END_DATE GRAPH_TYPE ORGANISATION
Examples:
-
view 2020-03-01 2020-03-31 pie tag -
view 2020-03-01 2020-03-31 bar month
Exporting report: export
Exports the current report shown in the report window.
Format: export FILE_NAME
| The file can be identified by FILE_NAME.png whereby FILE_NAME is specified by your input in the command. The file can be found in the Report folder which will be in the same directory as the jar file if you are running it by double-clicking the jar file. If you run the jar file on cmd, the Report folder will be located in the directory where you run the jar file. |
Printing report: print
Prints the current report shown on the report window.
Format: print
| For best usage, avoid sending multiple print jobs in short period of time. This prevents the print jobs from getting lost. The window may be unresponsive if the default printer is not set up, this will last for a few seconds. Eventually, a response stating "Set available printer as default printer before printing" will be given. |
Help: help
Shows the user the commands they can enter.
Format" help
Exiting the report window: exit
Exits the report window.
Format: exit
Contributions to the Developer Guide
Given below are sections I contributed to the Developer Guide. They showcase my ability to write technical documentation and the technical depth of my contributions to the project. |
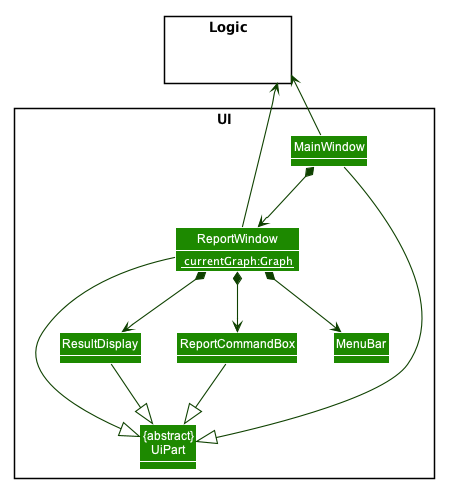
The Report UI consists of a ReportWindow that is made up of parts e.g. ReportCommandBox and Result Display etc.
The ReportWindow and ReportCommandBox, inherit from abstract UiPart class.
The Report UI component uses JavaFx UI framework. Layout of ReportWindow is defined in .java file that is in the src/main/java/seedu/saveit/ui folder. For example the layout of ReportWindow is specified in ReportWindow.java.
Layout of ReportCommandBox is defined in the matching .fxml file that is in the src/main/resources/view folder.
For example, the layout of the ReportCommandBox is specified in ReportCommandBox.fxml.
The Report UI component,
-
Executes user commands using the
Logiccomponent.
Report (Ng Xinpei)
Report is one of the main features in $AVE IT and its purpose is to collate and
show users their expenditure breakdowns.
Rationale
The report feature is an important feature that allows users to see their expenditure breakdowns within a certain time period. Currently, the expenditure are categorise in terms of tags and this will give users a clear overview of what they are spending on over this period of time.
Implementation
The report feature can be accessed from 2 platforms either Main Window or Report Window
-
Main Window
The input from user is parsed using a specific command parser
depending on which of the 3 commands: report view, report print and report export were inputted by user.
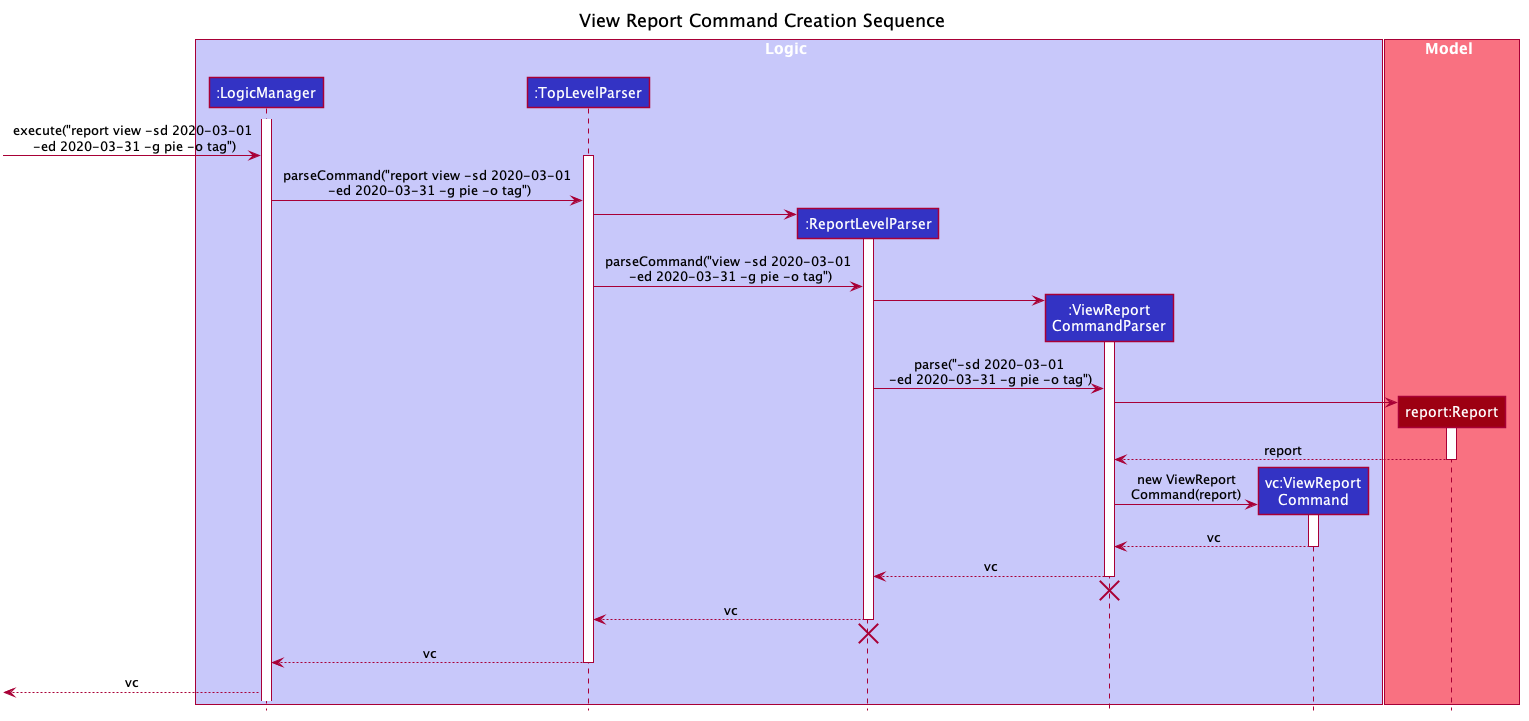
If a valid report view command was input, the ViewReportCommandParser will parse the input and convert the Strings :
start date, end date, graph type and organisation into Date , Report.GraphType and organisation(String) object respectively.
These objects are used to create the ViewReportCommand object. The figure above shows how the different objects interact to create
ViewReportCommand object.
As shown in the figure above, when a user inputs a valid report view command:
-
report viewcommand will be parsed and a new Report object will be created. -
A new ViewReportCommand object containing the Report object will be created.
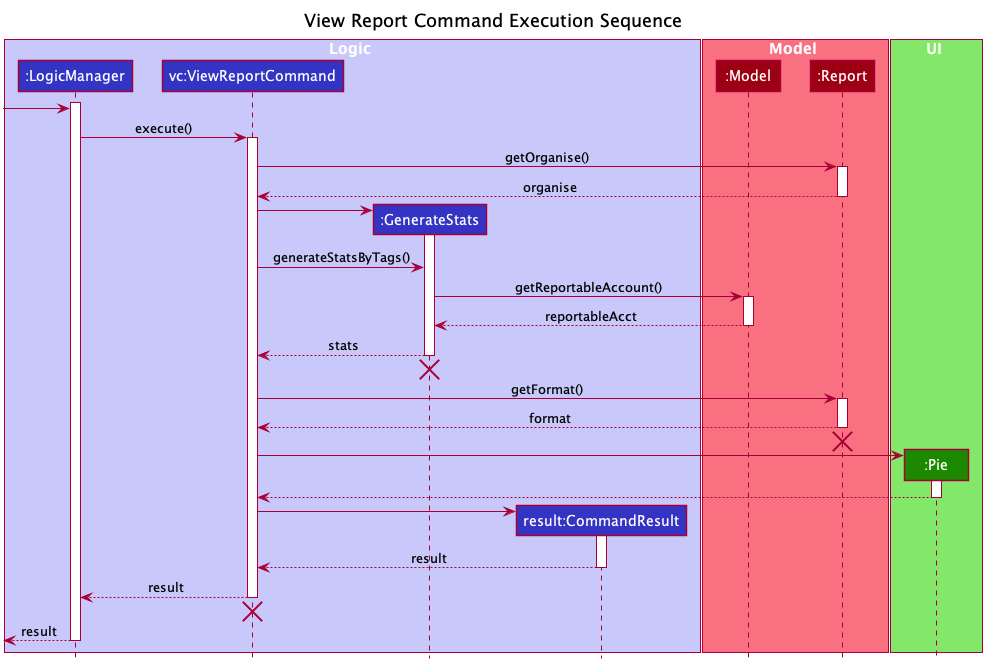
The ViewReportCommand object will be executed. The result of the execution is popping out of ReportWindow which will showcase a expenditure breakdown report. The figure above shows how the objects interact to execute ViewReportCommand object.
As shown in the figure above,
-
The ViewReportCommand object will be executed and a new GenerateStats object will be created.
-
The GenerateStats object will calculate and generate statistics from ReportableAccount object requested from Model through
getReportableAccountmethod. -
A new Pie object will be created.
-
A new CommandResult will be constructed and returned.
-
Report Window will pop out.
If a valid report print command was input, the PrintReportCommandParser will parse the input and convert the Strings :
start date, end date, graph type into Date, Report.GraphType and organisation(String) object respectively. These objects
are used to create PrintReportCommand object which will be executed.
The result of execution will be sending a print job to your printer, printing out the report.
If a valid report export command was input, the ExportReportCommandParser will parse the input and convert the Strings :
start date, end date, graph type into Date, Report.GraphType , organisation(String) and file name(String) object respectively.
These objects are used to create ExportReportCommand object which will be executed.
The result of execution will be exporting a PNG version of the report into your computer with file name.
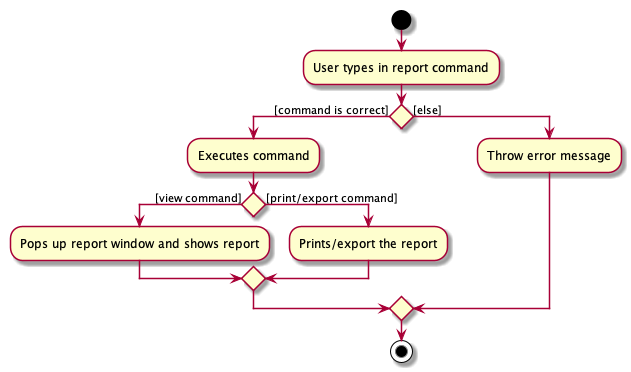
The activity diagram summarises what can happen when user
enter a report command in the Main Window
-
Report Window
The Report Window can be accessed via the Report button in the Main Window or via report view command.
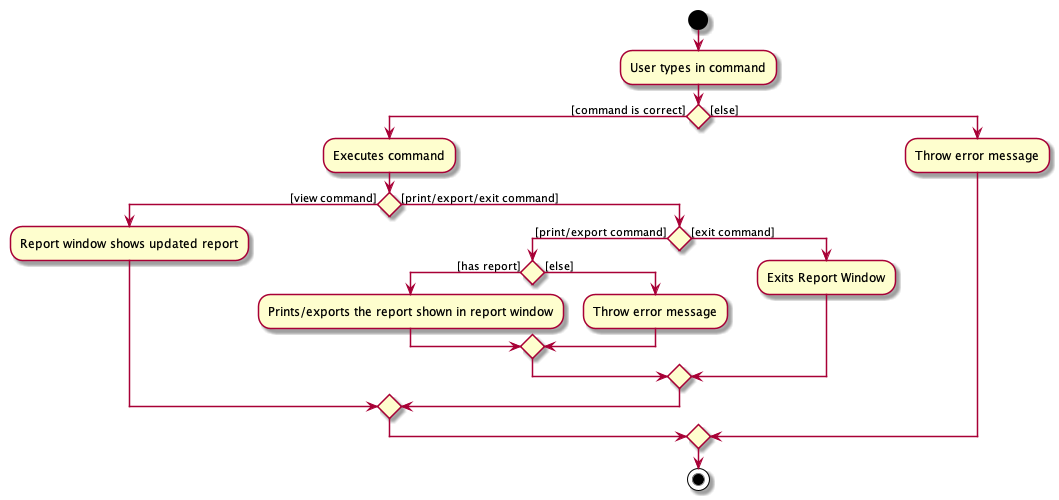
The activity diagram shows what can happen when users enter in a new command in the Report Window.
Design Considerations
Consideration : Minimal changes to current UI implementation, especially Main Window
-
Pros: Less dependency with current working code for Main Window. Hence, even if report feature fails, it is likely that Main Window can continue running.
-
Cons: It could be more complicated to implement.
Consideration : Avoid cluttering the Main Window UI
-
Pros: Better user experience.
-
Pros: As report is not using any space in Main Window, we could introduce and showcase other smaller and useful features in the Main Window UI.
-
Cons: It could be more complicated to implement
Due to the above considerations, we implemented report viewing in a pop up window.
NOTE
-
While it is allowed for users to state any date range for report and have any number of tags, it is recommended to them that to keep the date range within 12 months for reports generated by months or keep number of tags to be within 12 for reports generated by tags due to sizing issues.
-
Overlaps can occur in PieChart when there are huge differences in expenditure values, hence it is recommended to users that Bar Chart should be used in such instances.
-
While it is allowed for users to send multiple print jobs, users are recommended to avoid sending multiple print jobs in a short interval. The window may be unresponsive if the default printer is not set up, this will last for a few seconds. Eventually, a response stating "Set available printer as default printer before printing" will be given.
-
Only months or tags with total spending of more than 0 dollars will be reported.
-
The Report folder is located at the directory where you run the jar file.